Dr. Pate’s Prescription for Change
St. Luke’s Data Use Is Improving Patient Care


Reams and reams of data. We've got lots of data. But it’s those health systems that can convert data to actionable information that will be able to improve quality at the fastest rate. Better yet, if that information can be put in front of physicians in a convenient way and updated at optimal intervals, those physicians will continue to improve quality.
- David C. Pate, M.D., J.D.
Better vaccination rates, more preventive screenings and a host of other health results are beginning to pour out of the working relationship between St. Luke’s Health System and WhiteCloud Analytics.
Just three years after St. Luke’s Health System partnered with the Boise-based company, the joint effort is demonstrating how valuable applied data can be in modern health care, helping providers target minor concerns before they become major problems and saving patients untold sums in the process.
The dashboard tool developed through the relationship, which gives St. Luke’s physicians and leaders a window into the vast mountains of data increasingly available, has evolved since it was first introduced, with notable changes happening in recent months.
The Measures Committee, chaired by Dr. Bill Jonakin and including physicians, physician leaders, clinicians, administrators and data experts, has been refining the dashboard to optimize its benefits, according to Dr. Kurt Seppi, St. Luke’s executive medical director.
“The tool needs to evolve over time,” Dr. Seppi said, “and due to feedback from providers, changes were made.”
The dashboard’s performance metrics are built around measures from the Medicare Shared Savings Program (MSSP), and the improvements inspired by those measures are applied throughout St. Luke’s Health System.
At St. Luke’s Internal Medicine, the aggregated data is discussed at regular provider meetings, said Dr. Laura McGeorge, the clinic’s division medical director. Providers and clinic staff are energized and motivated by the improvements they can see each month when new data is released. If the results are not as expected, process changes can be made and the data is monitored for improvement.
“This is meaningful to all staff, because we can analyze and compare clinic to clinic to see how we are accomplishing things, and we can roll that best practice out across clinics,” said Dr. McGeorge, a primary care physician and Measures Committee member.
Clinicians are able to see rapidly how examining a data point and moving in where there is opportunity can yield dramatic results, she said.
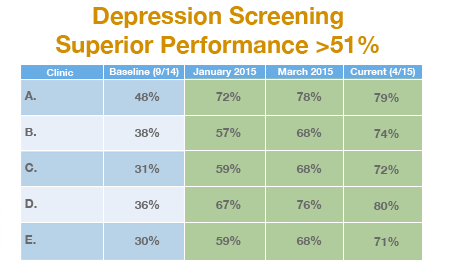
“The first thing we worked on was pneumococcal vaccination rates, and those rates went up. The next year, we worked on colon cancer screening, then colonoscopy screening rates went up,” Dr. McGeorge said. “Fall-prevention screening increased because we identified a gap and put a process in place.”
Focusing on screening and prevention helps people avoid illnesses and accidents that can lead to poor health, hospital stays and/or costly medications.
For example, pneumococcal vaccines can help prevent infections such as pneumonia. And colonoscopy screenings are strongly recommended for people ages 50 and older, because colon cancer screening has been shown to save lives.
As St. Luke’s moves into population health management, the dashboard offers a more direct line of communication between physicians and patients. It produces fresh data each month, giving physicians valuable and timely information that helps them understand how their patients are doing.
Many hospitals and health systems are still grappling with how to apply big data, and companies outside of Idaho have commented that few organizations have taken the approach St. Luke’s has adopted, according to Alyson Powell Erwin, Measures Committee member and senior partner for analytic solutions at WhiteCloud.
“St. Luke’s is way ahead in this area,” Erwin said.
Many organizations get data once a year, when it is presented in a spreadsheet assembled manually. In those situations, Erwin explained, physicians have no idea how they are doing with patient-centered measures and quality measures, because they don’t get information frequently enough.
In 2015, St. Luke’s MSSP metrics improved by nearly 10 percent overall, and Erwin believes the dashboard was a significant driver for that improvement.
“It’s because we have a mechanism (a dashboard) that allows us to measure what we are improving,” she explained. “If we weren’t able to transparently see that data, we wouldn’t be able to improve it.”
About The Author

Chereen Langrill was formerly a communications coordinator for St. Luke’s Health System.